When an application manipulates the DOM in bulk and then reads or writes a geometry property like scrollTop, the browser is forced to calculate layout synchronously before it can continue. This main thread block is known as a Forced Synchronous Layout (FSL) and produces visible spikes in the Chrome DevTools Performance Panel that affect users.
What is a Forced Synchronous Layout?
The browser batches style and geometry changes to process them efficiently at the end of each frame. When JavaScript invalidates styles (for example, by toggling a CSS class) and then immediately accesses a geometry property (like scrollTop, offsetHeight, or getBoundingClientRect()), the browser cannot wait: it must recalculate styles and layout right then, synchronously, blocking the main thread.
The problematic sequence is:
- Style invalidation: e.g.
element.classList.toggle('state-a') - Immediate geometry access: e.g.
container.scrollTop = 0
Step 2 forces the browser to complete Recalculate Style + Layout before it can continue, generating a long RunTask in the Performance Panel.
How to reproduce it
The example repository nucliweb/forced-synchronous-layout contains a Vanilla JS demo with 3,000 DOM elements and expensive CSS selectors (:nth-child) to amplify the effect.
// Problematic version — Forced Synchronous Layout
function reproduceIssue() {
  // Step 1 — bulk style invalidation
  container.classList.toggle("state-a");
  container.classList.toggle("state-b");

  // Step 2 — immediate geometry access → FSL
  container.scrollTop = 0;
}
// Fixed version — double requestAnimationFrame
function fixIssue() {
  container.classList.toggle("state-a");
  container.classList.toggle("state-b");

  // First rAF: lets the browser process Recalculate Style + Layout naturally
  requestAnimationFrame(() => {
    // Second rAF: style tree is clean, no FSL
    requestAnimationFrame(() => {
      container.scrollTop = 0;
    });
  });
}
A single requestAnimationFrame is not enough: the rAF fires before the browser runs Recalculate Style + Layout for that frame, so the styles are still marked dirty (invalidated, pending recalculation) and accessing scrollTop forces layout anyway.
The double rAF breaks the cycle because it changes the order in which things happen:
- 1st rAF: styles are dirty, but we do not touch geometry. The browser processes
Recalculate Style + Layoutnaturally at the end of the frame, without any synchronous block. - 2nd rAF: runs in the next frame with a clean style tree.
scrollTop = 0no longer forces any additional layout.
Detecting it in Chrome DevTools
Performance Panel: flame chart
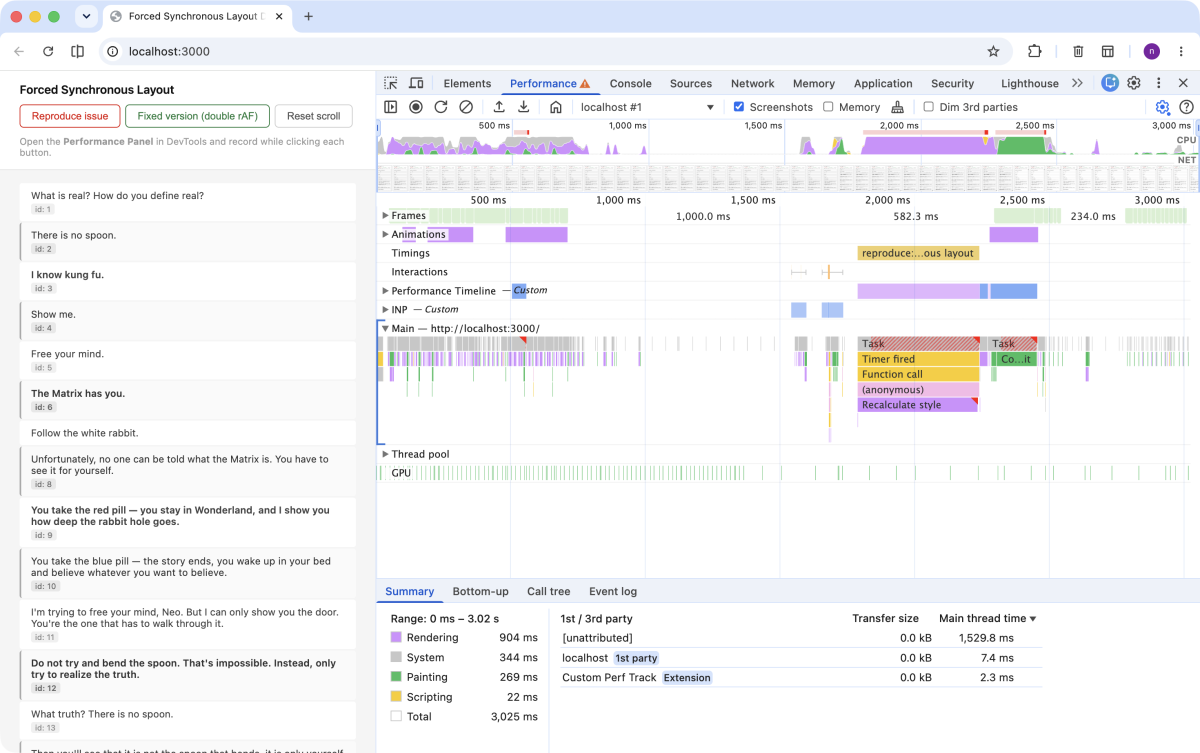
Record a session in the Performance Panel while clicking the “Reproduce issue” button. You will see a long RunTask composed of:
- Timer Fired: the demo’s
setTimeout - Function Call: call to
reproduceIssue() - Recalculate Style: forced style recalculation after the invalidation
- Layout: geometry calculation forced synchronously by
scrollTop
With the fixed version (requestAnimationFrame), Recalculate Style still happens, but it is no longer an FSL: it runs naturally within the next frame’s rendering cycle, without blocking JS. The original task finishes sooner and frees the main thread. If the CSS selectors are expensive or the DOM is large, that Recalculate Style will still take time, but it no longer interrupts code execution.

Enabling Selector Stats
To get detailed data on which CSS selectors are most expensive, enable Enable CSS Selector Stats before recording:
- Open the Performance Panel
- Click the gear icon (⚙️) in the top-right corner
- Enable Enable CSS Selector Stats
- Record a new session

Selector Stats tab
After recording, select a Recalculate Style event in the flame chart and open the Selector stats tab in the bottom panel. You will see a table with:
| Column | Description |
|---|---|
| Elapsed (ms) | Total time spent evaluating that selector |
| Invalidation count | Times the selector was invalidated |
| Match attempts | Number of elements evaluated |
| Match count | Elements that matched |
| % of slow-path | Percentage of evaluations that could not use the fast path |
| Selector | The CSS rule |
Selectors at 100% slow-path are the most expensive. In the demo, the :nth-child selectors applied to 3,000 elements all appear at 100%.

An important clarification: the “slow” option inflates the timings
A common question here: if we disable “Enable CSS Selector Stats”, does the Recalculate Style disappear? No. The event is generated by the code, not by DevTools.
What the option does is attach a timer to every CSS rule to record how long each selector takes to evaluate. That extra bookkeeping has a cost: the same Recalculate Style that takes ~80 ms without the option can appear as ~226 ms with it enabled.
The real production figure is the time without the option enabled. Selector Stats inflates the duration to give us debugging data, not to reflect production reality. Even so, the problem is real: any Recalculate Style above 50 ms is already a long task that blocks the main thread.
What Selector Stats tells us about the problem
Selector Stats does not show the FSL directly (that shows up in the flame chart), but it explains why that FSL is so expensive. The more costly the Recalculate Style (many nodes, slow selectors), the longer it blocks the main thread when forced synchronously.
In the repo example, the table shows for the forced Recalculate Style:
- 1,220 ms of total time evaluating selectors
- 12,002 invalidations and 79,261 match attempts
- The three slowest selectors, all at 100% slow-path:
.scroll-container .item-list .item:nth-child(2n)→ 271 ms.scroll-container .item-list .item:nth-child(3n)→ 253 ms.scroll-container .item-list .item:nth-child(5n)→ 232 ms
Two sides of the same problem: the FSL forces the recalculation, and the expensive selectors make it painful.
Impact on INP
The FSL does not only block the current frame: it can directly degrade INP (Interaction to Next Paint), the metric that measures the latency of the slowest interaction.
INP breaks down into three phases:
- Input Delay: time the interaction waits before it can be processed
- Processing Time: time the event handlers take to execute
- Presentation Delay: time the browser needs to calculate styles, layout, and paint the frame
The FSL affects phases 2 and 3. When scrollTop = 0 runs inside an event handler, it forces the browser to complete the Recalculate Style synchronously, extending the Processing Time. While that long task holds the main thread, any interaction queues up, raising the Input Delay for subsequent interactions.
The real risk is that a trace may show an excellent INP (e.g. 31 ms) because the captured interaction was fast. But if a click happens right when a task of several hundred milliseconds fires, the visual delay can exceed half a second. The recorded INP does not reflect that case.
Using requestAnimationFrame moves that Recalculate Style to the next frame: the task finishes sooner, the main thread is freed, and interactions are processed with minimal latency.
Detecting FSL with a console snippet
The Performance Panel is the definitive tool for analyzing FSL, but it comes with overhead: you need to record a session, find the long task in the flame chart, and navigate to the specific event. For faster detection during development, the Forced Synchronous Layout snippet from WebPerf Snippets offers a more immediate alternative.
The snippet intercepts two categories of operations:
- Style mutations:
classList.add/remove/toggle,setAttributeforclassorstyle, and assignments tostyle.cssText. - Geometry reads:
scrollTop,scrollLeft,clientWidth,offsetTop,getBoundingClientRect(), and similar properties.
When it detects a geometry read immediately after a mutation, it emits a console warning with the accessed property, the affected element’s selector, the time elapsed since the mutation, and the call stack.
// The snippet warns in the console when it detects this pattern:
container.classList.toggle("state-a"); // style mutation
container.scrollTop = 0; // immediate geometry read → FSL detected
It is especially useful for catching FSL in flows where the Performance Panel is not actively recording: during code reviews, in CI with Puppeteer or Playwright, or simply with the console open while navigating the application.
Conclusion
A Forced Synchronous Layout is easy to introduce and hard to spot without the right tools. The Chrome DevTools Performance Panel lets you locate it in the flame chart, and the Selector Stats tab, with “Enable CSS Selector Stats” enabled, reveals which CSS rules amplify its cost. The fix is to defer any geometry write with requestAnimationFrame to break the synchronous invalidation → access → forced layout cycle.