> Whenever someone shows me a dashboard with metrics, the first thing I do is evaluate the interface design and how the data is displayed. I like dashboards with data. Once I've done that analysis, which takes me no more than 4 or 5 seconds, I ask: what am I seeing? How do I interpret what I see?
**A metric number is just a number, until we know how to interpret it.**
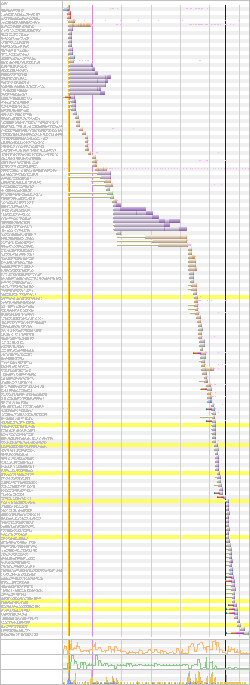
As an example, take a look at this graph, what do you think?

Without any context we can't know if it's good data, if we have room for improvement, or if it's bad.
That's why it's very important to know what we're looking at and how we should interpret the data.
## The Question
A friend, we'll call him F, asks me:
**F**: Joan, I have a question. How does adding a library that loads on the client impact performance? It's GA4, they're loading it on the client, and since the data _(the performance avg)_ hasn't changed, they tell us it doesn't have an impact.
> Here I could put any gif (in [video format](https://perf.reviews/blog/video-en-la-web/) of course), but since I care about your UX, I won't consume your network data. I'll leave my reaction to your imagination.
I analyze the data that "validates" the hypothesis that adding a third-party library hasn't affected anything, and I quickly detect what the problem is.
## The Problem
As you might imagine, the problem is not having context to interpret the data that was looked at before and after adding that library.
### What's the problem?
Web Performance is being monitored without loading the new library. How can this happen? Easy, European data protection law indicates that to collect user data, they must explicitly give consent... the famous consent modal.
If we use a tool like [Page Speed Insights](https://pagespeed.web.dev/), the reading it will take is of a first load, without cache. _This deserves another post_, but I'll focus, because as my Engineering Manager tells me, I get scattered by wanting to go into detail on everything I explain... the thing is that the first load of a visited website, from Europe, must show the information and acceptance of authorization so that data can be collected.
Well, that's what's happening in that first reading with a tool like [Page Speed Insights](https://pagespeed.web.dev/), which leads us to a false performance reading, since third-party scripts aren't being loaded until consent is given. I'm sure you're already thinking it, of course, if there are no accepted consents, there are fewer scripts being downloaded or altering the DOM.
This leads us to have a better performance reading than what returning visits that have already given consent have.
> When you see a report like the one we can see in [Page Speed Insights](https://pagespeed.web.dev/), look at the screenshot that appears, usually the consent modal is shown. Oh! Usually in the [Lighthouse](https://developer.chrome.com/docs/lighthouse/overview/) you run from Chrome DevTools, you won't see the modal because (unless you delete cookies) you'll have the consent acceptance cookie.
### Let's See an Example
I'm going to use [WebPageTest](https://www.webpagetest.org/), as it will allow us to evaluate both scenarios and understand the big difference.
> If you're interested in me creating content about [WebPageTest](https://www.webpagetest.org/), leave a like on this [tweet](https://twitter.com/nucliweb/status/1633028112790310915)
We'll analyze the website of one of the products we have at the company I work for, [Adevinta](https://www.adevinta.es/): [Coches.net](https://www.coches.net)
#### Analysis
We access [WebPageTest](https://www.webpagetest.org/) and insert the URL in the field.
I'm going to make some changes to the default configuration in the _Advanced Configuration_ section:
- I select the server location from which the test will be done. In our case I select Paris, due to proximity, since our product is focused on Spanish users.
- I select it to run the test 5 times, to get an average.
- As I mentioned that the cache topic will be covered in another post, I leave the _Repeat View_ option selected with a value of _First View Only_

All ready, we run the test... and [here](https://www.webpagetest.org/result/230303_AiDcZ1_DHY/) we have the result.
[](https://www.webpagetest.org/result/230303_AiDcZ1_DHY/)
#### Let's Analyze the Result
In the test [result](https://www.webpagetest.org/result/230303_AiDcZ1_DHY/) we'll see the _Observed Metrics_, with lab metrics and _Real User Measurements_ with field metrics (real users), but now we're interested in scrolling down a bit and seeing the information we have in the _Individual Runs_ section. In this test, as we indicated, we have 5 _runs_, and the third one is offered as the average.
To see the detail, we click on the image under _Waterfall_, and we'll access the test [detail](https://www.webpagetest.org/result/230303_AiDcZ1_DHY/3/details/#waterfall_view_step1). We'll see we have a lot of information, but today we're going to focus on _Waterfall View_, specifically on the number of requests. Which in this case are **86 requests**.
In the upper right part of the test, we can see a screenshot of the website, and the cookie acceptance modal is clearly visible.

Let's do a test with accepted consents.
#### Analysis with Consents
One of the things WebPageTest allows us to do is execute [scripts](https://docs.webpagetest.org/scripting/) to emulate user behaviors. So we'll do a test emulating a visit with previously accepted consents.

To do this we return to the [WebPageTest](https://www.webpagetest.org/) home, and this time we access directly the _Advanced Configuration_ section, with the same configuration as the previous test. To define the behavior, we access the _Script_ tab and insert the following code:
```
logData 0
navigate https://www.coches.net
execAndWait document.querySelector('[data-testid="TcfAccept"]').click()
clearCache
logData 1
navigate https://www.coches.net
```
[Here](https://www.webpagetest.org/result/230303_AiDcVA_F8C/) we can see the test result, and just like before, if we access one of the [details](https://www.webpagetest.org/result/230303_AiDcVA_F8C/2/details/#waterfall_view_step1) we'll see that the number of requests has increased to **157**.
This is because now third-party scripts are being loaded that are collecting data to personalize the experience, but of course, at the cost of downloading more resources.
#### Comparison
| Without consent acceptance | With consent acceptance |
| ---------------------------------------------------------------------------------------------------------------------------------------------------------------------------------- | ------------------------------------------------------------------------------------------------------------------------------------------------------------------------------- |
|  |  |
### Conclusion
Returning to F's question, by monitoring performance in a scenario where third-party scripts weren't being loaded due to not having accepted consents, no matter how many scripts were added, performance degradation wasn't being reflected. And evidently that wasn't the reality for users.
So we have to know and understand what we're analyzing and monitoring to be able to assess changes in those metrics.