> Google continues to provide us with tools to improve the performance of our products. This time they bring us a tool integrated into Chrome DevTools to analyze the web performance of the navigation flow of visitors to our website or application.
## What do we achieve with this new tool?
The idea is to be able to record a navigation flow, for example when purchasing a product in an eCommerce. Once recorded, the tool performs the same flow automatically, but this time it's also recording the website's performance.
It's as if at each step we take, we go to the "Performance" tab and launch an analysis. What this new tool improves is being able to see the performance of the entire navigation, interaction and loads of the recorded flow in a single timeline.
## How can we do it?
The first thing we should do, after opening Chrome DevTools, is access the new Recorder tab, which will show us the following content.
 What we can see are the 3 simple steps we must take to measure the [User Journey](https://en.wikipedia.org/wiki/User_journey), a button to start using the new functionality, a box informing us that it's a feature in development, along with a [link](https://developer.chrome.com/docs/devtools/recorder/) to the official documentation and inviting us to send them feedback. What's interesting is that by clicking on the feedback button, we can [see](https://bugs.chromium.org/p/chromium/issues/detail?id=1257499) the feedback sent by other users.
### 3, 2, 1... recording
For the example I'm going to use the [Next.js Commerce](https://demo.vercel.store/) demo from [Vercel](https://nextjs.org/commerce).
The first thing we should do is be on the website we want to analyze, so I open [demo.vercel.store](https://demo.vercel.store/) in the browser, then [open Chrome DevTools](https://developer.chrome.com/docs/devtools/open/).
Once in the Recorder tab, I start my first recording by pressing the Start new recording button.
We'll see that it asks us to enter a name for the recording. I advise being as explicit as possible, since after a few tests, it will be easier to identify them. _I add the date, in case in the future I do the same test again, but something has changed in the flow_.
What we can see are the 3 simple steps we must take to measure the [User Journey](https://en.wikipedia.org/wiki/User_journey), a button to start using the new functionality, a box informing us that it's a feature in development, along with a [link](https://developer.chrome.com/docs/devtools/recorder/) to the official documentation and inviting us to send them feedback. What's interesting is that by clicking on the feedback button, we can [see](https://bugs.chromium.org/p/chromium/issues/detail?id=1257499) the feedback sent by other users.
### 3, 2, 1... recording
For the example I'm going to use the [Next.js Commerce](https://demo.vercel.store/) demo from [Vercel](https://nextjs.org/commerce).
The first thing we should do is be on the website we want to analyze, so I open [demo.vercel.store](https://demo.vercel.store/) in the browser, then [open Chrome DevTools](https://developer.chrome.com/docs/devtools/open/).
Once in the Recorder tab, I start my first recording by pressing the Start new recording button.
We'll see that it asks us to enter a name for the recording. I advise being as explicit as possible, since after a few tests, it will be easier to identify them. _I add the date, in case in the future I do the same test again, but something has changed in the flow_.
 Now we can reproduce the navigation flow that we want to do a performance analysis of.
> At this point we have to keep in mind the flow we want to navigate 😉
Now we can reproduce the navigation flow that we want to do a performance analysis of.
> At this point we have to keep in mind the flow we want to navigate 😉
 Now we can replay the flow we recorded by clicking the Replay button to validate that everything works correctly. We'll see that the same flow we just did is automatically reproduced.
Once we've seen that the flow works well and is correct, we can create the performance report of the entire flow by clicking the Measure performance button and diving into the large amount of data that the Performance tool offers us.
Now we can replay the flow we recorded by clicking the Replay button to validate that everything works correctly. We'll see that the same flow we just did is automatically reproduced.
Once we've seen that the flow works well and is correct, we can create the performance report of the entire flow by clicking the Measure performance button and diving into the large amount of data that the Performance tool offers us.
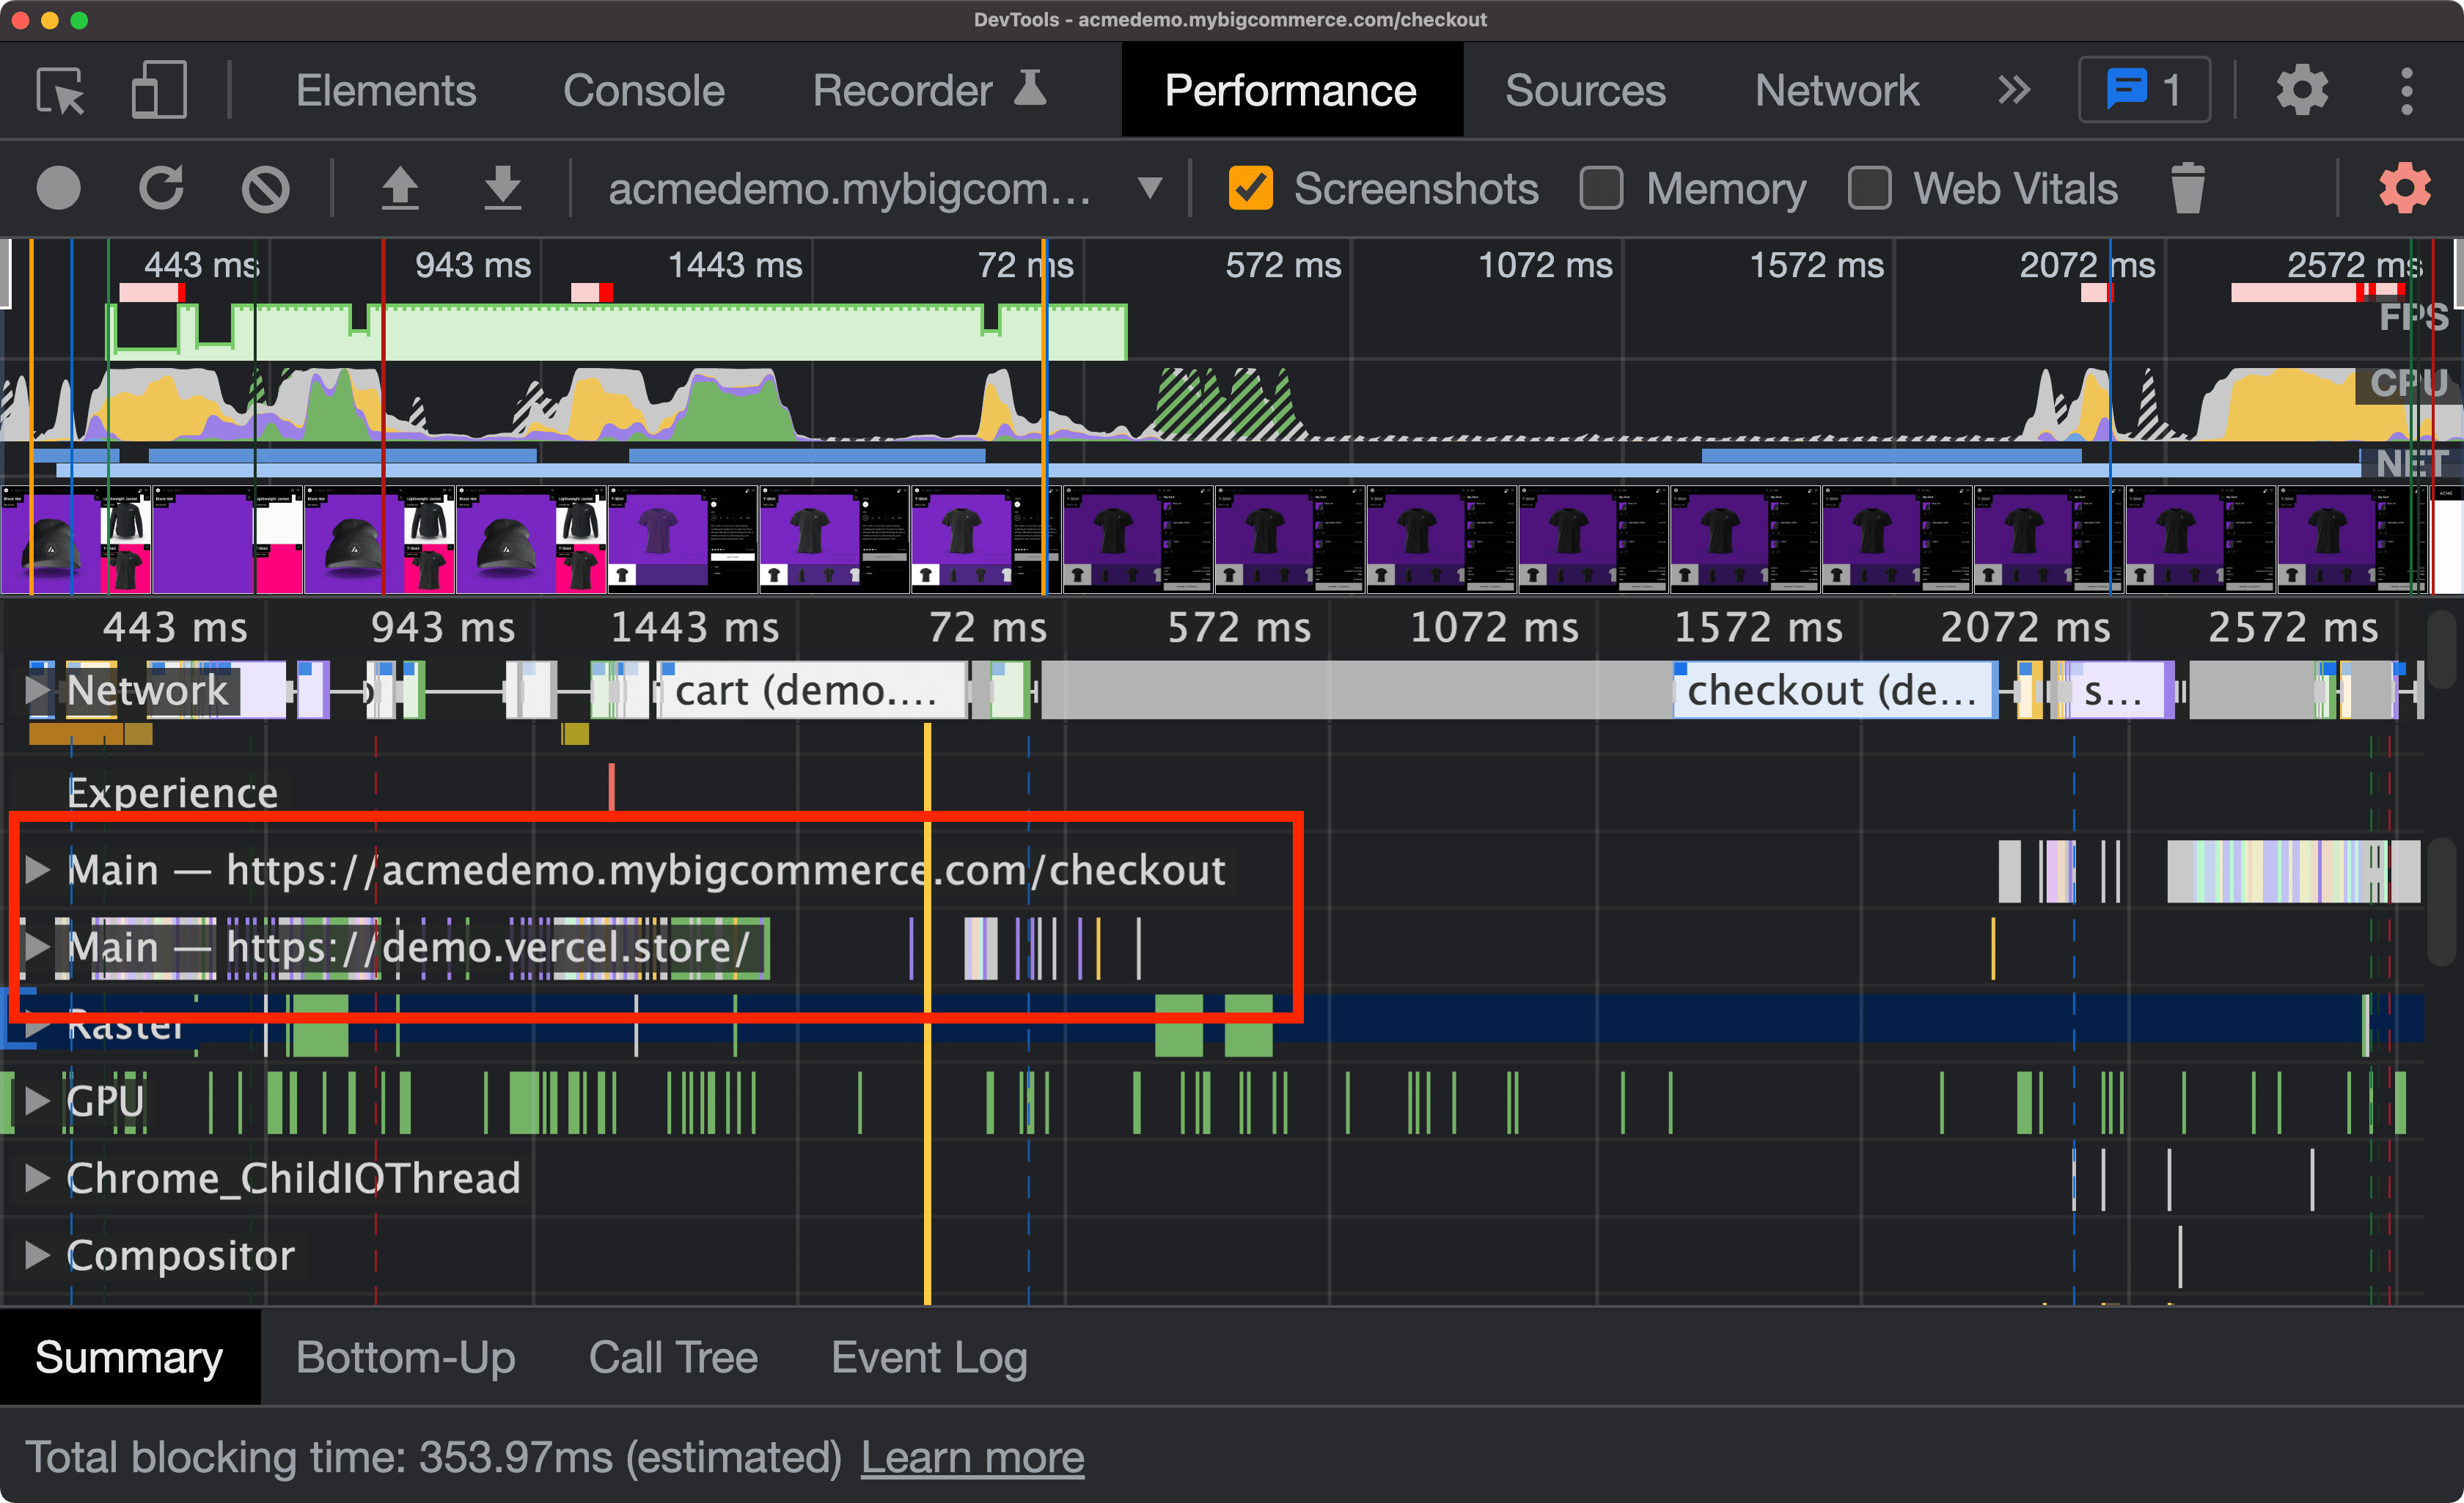
 As a curious fact, in this flow when checking out to access the shopping cart, the application accesses another domain, which is why we can see that there are two Main Threads.
 ## Beyond DevTools
One of the options available in this new functionality is being able to export the flow to a [Puppeteer](https://developers.google.com/web/tools/puppeteer) script.
## Beyond DevTools
One of the options available in this new functionality is being able to export the flow to a [Puppeteer](https://developers.google.com/web/tools/puppeteer) script.
 Source code
> This opens the doors to being able to automate processes... but we'll see that in a future article.
## When will it be available?
It's scheduled to be available in Chrome 97, for January 2022, but you can start using it now if you download the [Chrome Canary](https://www.google.com/intl/en/chrome/canary/) version.
Source code
> This opens the doors to being able to automate processes... but we'll see that in a future article.
## When will it be available?
It's scheduled to be available in Chrome 97, for January 2022, but you can start using it now if you download the [Chrome Canary](https://www.google.com/intl/en/chrome/canary/) version.